MixTur

 Interface
 App Usage
 App in Smart Phone

Project financed in 2011 by the National Public-Private Cooperation Program INNPACTO Subprogram of the Ministry of Economy and Competitiveness With the number IPT-2011-1207-410000.

Development of a mobile platform capable of offering a personalized service within face-to-face fairs, such as route calculation and presentation of information using augmented reality techniques, and also allowing communication between the fair's web portals and the real stage.
OBJECTIVE:
MIX-TUR aims to unite all the value of real and virtual information to be able to provide value-added services based on the concept of Mixed Reality, offering novel experiences in the tourism sector. The future trend in the world of events and conferences is the creation of hybrid events with virtual and face-to-face elements that complement each other, making it possible that distance is not an inconvenience for visitors and being able to transparently do the same activities both in person and virtually.
Therefore, this project focuses on the creation of a virtual platform that communicates with events and mobile applications that allow increasing user interaction within face-to-face events, using techniques such as augmented reality, computer vision and indoor route planning systems or presentation of information using Augmented Reality.
RESULTS:
The CeDInt VR Group has carried out the development of two fundamental elements:
1. The Augmented Reality application, whose functionalities include:
-
display information associated with the stand by pointing the camera of the mobile device at any of the reference elements found on it (e.g. the exhibitor's logo, catalogs, etc.)
-
the calculation and presentation of personalized routes through the different stands of the face-to-face fair, and assistance to inland navigation along these routes, taking as a reference images of the environment (eg logos, posters, etc.)
2. The metrics capture system in a face-to.face environment, based on a network of kinects, which allows monitoring activity at the stand in real time through the following metrics:
- number of visitors at the booth
- time of each visitor at the stand
- position of each visitor within the stand
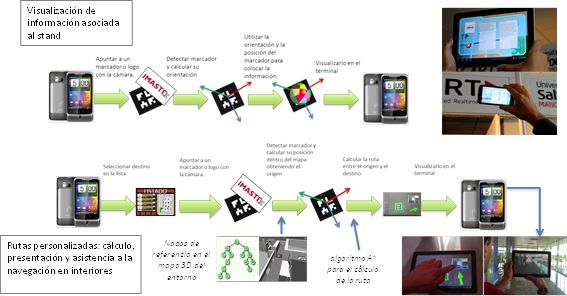
Figure 1/ Video 1– Augmented Reality Application
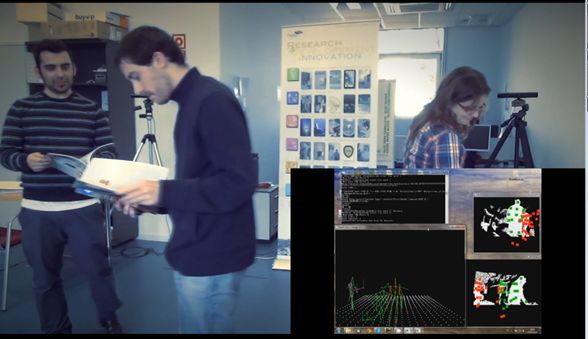
Figure 2/ Video 2– Metrics capture system in a face-toface environment
The above developments were integrated into the MIX-TUR service platform in order to assess their potential to support the activity of visitors and exhibitors at professional tourism fairs.
Performance tests and use of the MIX-TUR service platform
To check the correct operation of the MIX-TUR platform, a hybrid fair simulation (face-to-face) was carried out. For this purpose, four stands were placed in both the virtual and the real event corresponding to the following entities: CeDInt, Imaste, Turespaña and Infostand (see figure below)
.
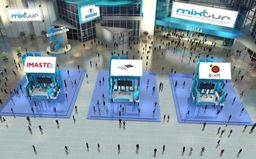
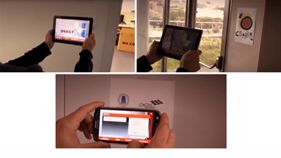
Figure 3– Booth plan in the virtual event (first) and logos of each stand in the face-to-face event (second)
Twenty people from outside the project participated in the tests of the mobile application and the in-person metrics capture system. The results of these tests are summarized below.
Tests of the Augmented Reality mobile application
In the face-to-face environment (located in the CeDInt building at the UPM Montegancedo Campus, Pozuelo de Alarcón.) The logos of each stand were positioned according to the physical location previously defined for the proof of concept. These logos function as markers to locate the user and show the information of each stand. As there were very few markers to cover the entire environment, elements installed in it (eg pictures, logos, signs, etc.) were used as a reference to locate the user within the building (see figure below). The application was installed on different terminals in order to validate the portability of the application at different resolutions and screen sizes.
The following figure summarizes the results of the test carried out on the 20 users who participated in the evaluation.
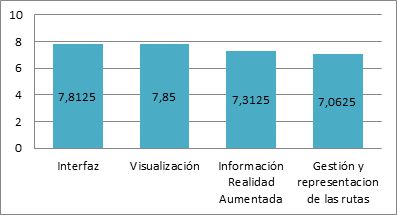
Figure 4- Average ratings for each aspect evaluated
From the data collected on the behavior of the application on the different routes carried out by users during the tests, both the reliability and the time required to complete a route have been measured (see figure below). The average time needed to travel the specified routes is two and a half minutes and the fastest routes were recorded by those users who pointed to a total of five markers along the route, which to points the aforementioned number as the optimum value for the travel.
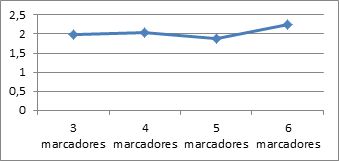
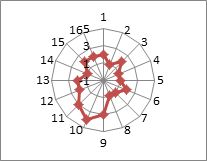
Figura 5- Time of routes and reliability of the markers
Similarly, the reliability of the markers pointed along the route has been measured, on a scale of 0 to 5, using the data offered by the Vuforia platform. In the latter case, the low differentiation between images (images with a large number of characteristic points in common) and their low illumination were identified as the two factors with the greatest impact (negative) on the reliability of the marker.
Tests of the metrics capture system
The CeDInt stand was configured to be able to test the metric capture system in a situation as similar as possible to the real application case. The stand area (3x4 meters) was marked on the ground and inside it, a motion capture system and some furniture were installed simulating the exhibitors and the visitors' area of a stand. Two Kinects connected to a PC were placed inside the stand, which in turn was connected to the network. At some points the decoration of the stand partially hindered the visibility of the Kinects, taking the capture system to the extreme. For the configuration and calibration of the metric capture system, the distribution of elements in the stand, the viewing angle of the cameras and the overlap between them were taken into account. The resulting configuration is shown in the following figure:
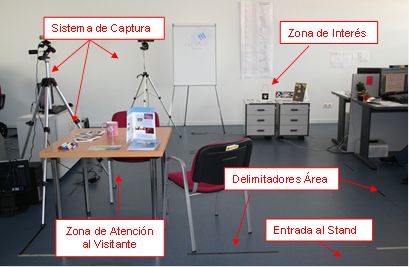
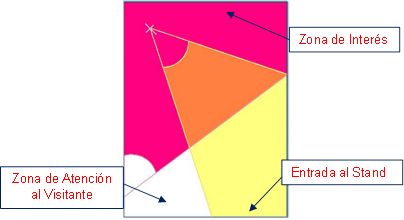
Figure 6– Physical configuration of the stand (upper image) and position and coverage area of the installed cameras (lower image)
During the tests, the system has collected the movements of the people who have passed through the stand, seeing and asking about the contents offered there. The tests carried out to evaluate the effectiveness of the system in capturing each metric and the main results and conclusions obtained in each case are summarized below:
Metric 1: Number of visitors in the stand
The test corresponding to the capture of this metric has consisted of simulating a moment of great attendance to the fair. To this end, people (up to a maximum of 15) have been gradually incorporated into the stand to check how many visitors it is capable of detecting simultaneously. This was done multiple times to obtain a meaningful sample of data.
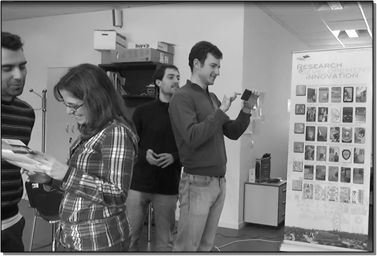

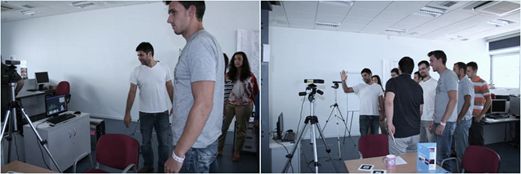
Figure 7- Test of metrics capture: number of users
Analysis of the results obtained shows that the system is capable of detecting up to 10 people at a time. This difference between real visitors and detected visitors is due to occlusions caused by themselves: when one user is right in front of another, the camera only detects the one closest to it. These occlusions could be avoided by adding more cameras, with the consequent increase in the cost of the system. Except for the times when the number of users exceeded the maximum of 10, during the tests there were no errors in the reported metrics. The number of visitors to the stand registered at all times and reported in real time by the metric capture system was always correct.
Metric 2: Time of the user inside the stand
The test designed to collect the data necessary to calculate this metric has consisted of capturing the information from visitors to our simulated stand. Although the test to capture metric 1 forced a situation with a large influx of public, in this case the system has been left running and the people who passed through it have been recorded without giving other information other than that they were in a stand to assess their behavior in the most natural way possible.
The analyzed results show an average time of stay inside the stand of 8 seconds. The metric capture system can take approximately two seconds to detect users, so the actual time spent by visitors inside the stand would be close to 10 seconds on average. Figure 8 shows a histogram with the time of the different users in which the horizontal axis corresponds to time and the vertical axis to the number of users.
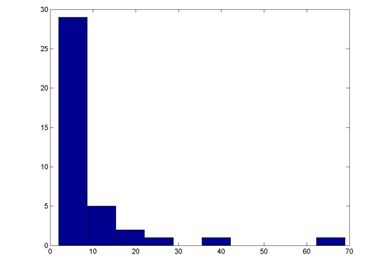
Figure 8- Histogram with the time spent in the stand
Metric3: Position of the visitors in the stand
The main objective of this metric is to place visitors inside the stand, so a series of heat maps have been calculated from the data obtained in the test carried out to obtain the data from metric 2. These maps illustrate the areas where users have passed marking with warmer colors those areas where there has been a higher density of users.
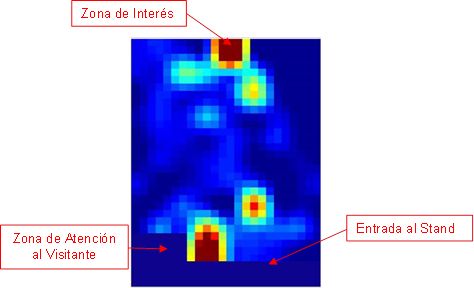
Figure 9- Heat map distribution of people during the test