INTUIT


Guided by the European ATM Master Plan, the SESAR JU is responsible for defining, developing, validating and delivering technical and operation solutions to modernise Europe’s air traffic management system and deliver benefits to Europe and its citizens. The SESAR JU research programme, known as SESAR 2020, is delivering solutions in four key areas, namely airport operations, network operations, air traffic services and technology enablers.


INTUIT, as a SESAR Exploratory Research project, has explored the potential of visual analytics and machine learning to improve the understanding of the trade-offs between ATM KPAs and develop new decision support tools for ATM performance monitoring and management.
Performance orientation in Air Traffic Management (ATM) is one of the cornerstones of the Single European Sky[1] (SES) and of its technological pillar, SESAR[2]. However, understanding ATM performances is not an easy task, since it results from the complex interaction of interdependent policies and regulations, stakeholders, technologies and market conditions. In this context, trade-offs arise at different levels, that is not only between stakeholders, but also between Key Performance Areas (KPAs), as well as between short- and long-term objectives. Therefore, there is an urgent need for improved performance modelling methodologies, able to grasp the interdependencies between different Key Performance Indicators (KPIs) and allow the assessment of the possible future impacts of a range of policies and technologies. To this end, a performance-based approach shall be based on defining policy in terms of qualitative performance objectives, making them measurable by defining appropriate indicators, developing the data and methodologies necessary to calculate such indicators, and having the expertise to maintain data quality and assess the link between indicator trends and management actions.
Approach and methodology
The first step to tackle the ATM performance problem included a deep review of the corresponding literature as well as a detailed assessment of the validity, the quality and the geographical and temporal resolution of the data sources currently at disposal. This starting point was then complemented with the outcomes of stakeholder consultations to define a Research Agenda on Data Science and ATM Performance. From there, a subset of the identified research questions was selected to be investigated in the form of three Case Studies (CS), namely:
- CS-1: Effect of unit rates on airline route choices and impact on ATM performance.
- CS-2: Sources of en-route flight inefficiency.
- CS-3: Multi-scale representation of ATM performance indicators.
Every CS was then studied according a three-step approach as follows:
- Exploratory data analysis, which involves the use of visual analytics and statistical analysis to identify patterns and trends and suggest potential modelling approaches;
- Data-driven modelling, which investigates how machine learning can be used to build predictive models able to complement or replace more conventional mechanistic models;
- Development of decision support tools, by integrating the newly developed models into an interactive dashboard facilitating the exploration and analysis of the modelling results.
The picture below illustrates this approach graphically.
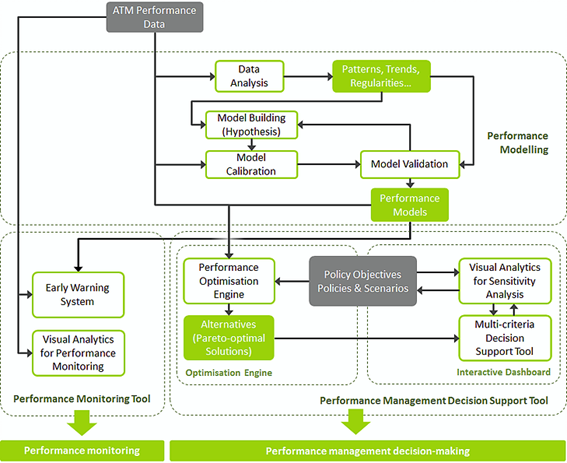
Figure 1 - Approach used in INTUIT for data-driven modelling and development of visualisation tools.
Results:
CeDInt was involved especially in the implementation of the interactive interfaces composing the decision support tools. As such, a set of dashboard has been implemented to allow professional end-users (e.g. network managers) to explore the results of the corresponding modelling activities and help them throughout their decision-making tasks. In particular, the dashboards for the visual exploration of CS-1 and CS-2 results have been developed.
Effect of unit rates on airline route choices and impact on ATM performance:
Airline route choice decisions are an important factor influencing ATM performance (e.g., environmental performance), especially during pre-tactical planning phases. Demand forecasting has traditionally relied on certain hypotheses about airline preferences and sensitive information such as airline cost of delays and aircraft weight at take-off. To bring to light performance issues, INTUIT has proposed the development of data-driven models that are trained on the basis of the observed airline behaviour, by relying on historical data such as that available from EUROCONTROL’s Demand Data Repository 2 (DDR2). Based on an initial step of data exploration, a variety of machine learning techniques were used to develop models for the prediction of airline route choices, for a given pair of origin-destination airports. This led to define a route choice predictor which, in turn, was coupled with a multi-objective optimisation tool. Finally, the results of such integration has been added to an interactive dashboard allowing the exploration of the effects of a particular setting of unit rates and supporting the user in the selection of the unit rates that optimise a certain cost function. The dashboard provides a set of interactive visualisation tools that allow the user to assess how different combinations of unit rates on the flights serving a certain OD pair would affect flight efficiency, cost efficiency and capacity, and to explore the resulting impact on relevant airlines and Air Navigation Service Providers (ANSPs). The following figures shows some of the main features deployed for this dashboard.
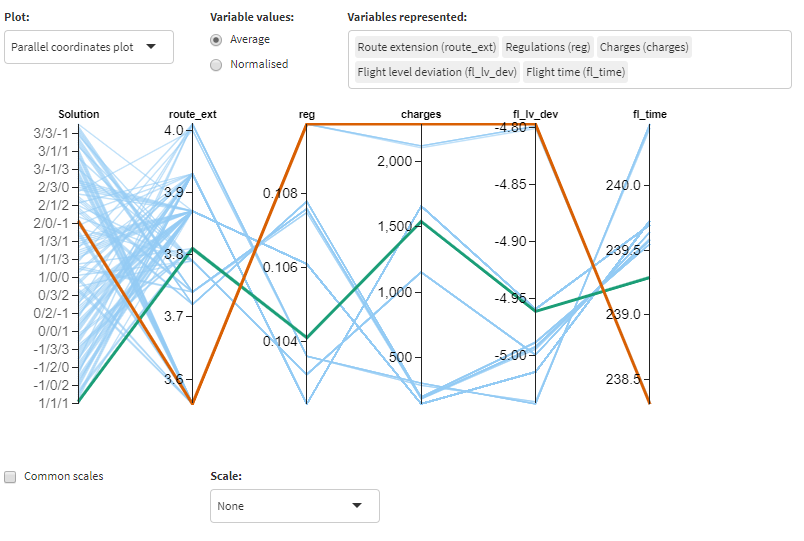
Figure 2 - Parallel Coordinate Plot to compare different attributes (columns) across optimisation solutions (lines). The green line represents a solution selected by the user; the orange line is the reference scenario (according to specific weights in the cost function). The lines trace different patterns in the definition of trade-offs among features.
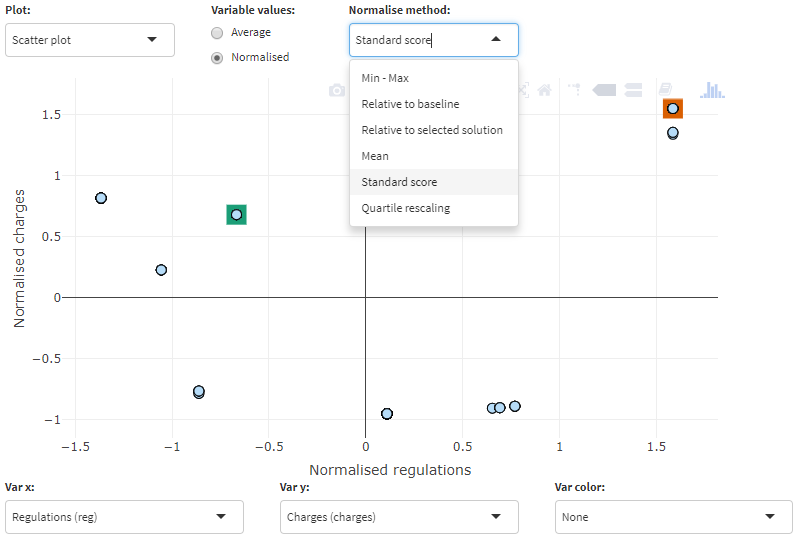
Figure 3 - Scatterplot representation of the optimisation solution space with respect to a pair of specific attributes (values normalised)
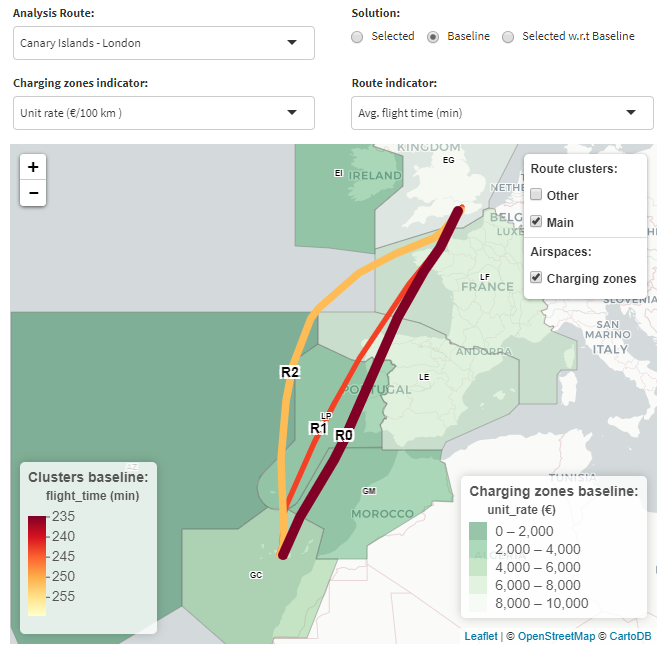
Figure 4 – Geographical representation of the three main route clusters for the pair Great Canary – London and ANSPs. Lines encode the number of flights for each route while the choropleth map shows the unit rates in a reference scenario.
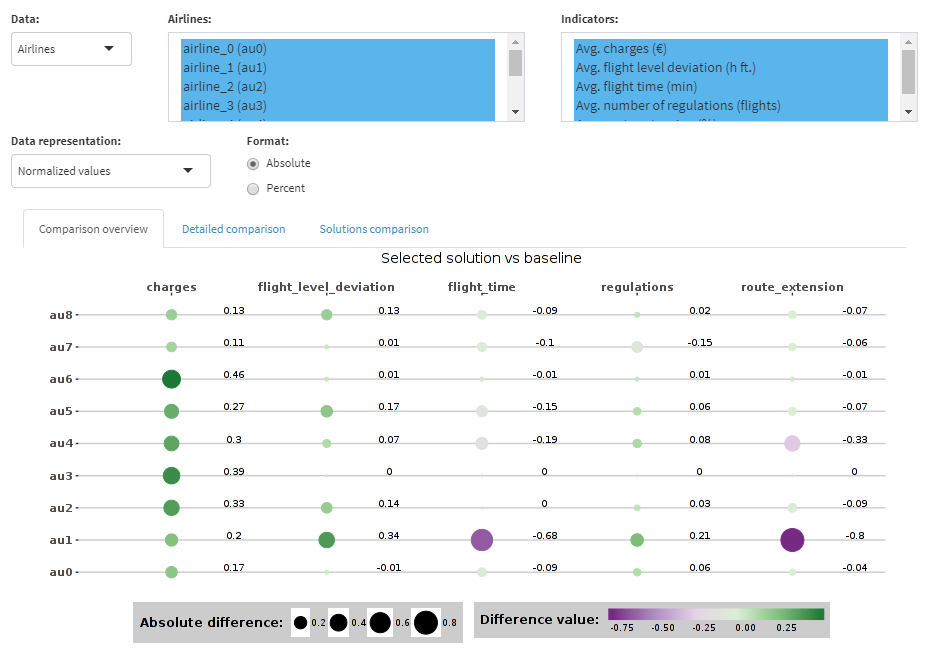
Figure 5 – Panel with a comparison overview of the estimated effects of an optimisation policy with respect to the baseline (the values are normalised for a fair comparison). In this case, the effects are computed with respect to the single airlines.
Sources of en-route flight inefficiency:
This case study focused on analysing the influence factors that drive the horizontal flight efficiency of the flights crossing a certain airspace area, in order to isolate the contribution of different factors and stakeholders. For instance, understanding whether the inefficiencies measured in a certain ACC are actually due to the closure of a certain airspace area in adjacent ACCs. The case study was conducted for the Bordeaux ACC (LFBBCTA). After exploring relevant data, the factors identified as potentially relevant were used to train different machine learning models aimed to estimate horizontal flight efficiency. As a result, the interrelationships revealed by the models helped to gain insights on the causes and effects of low performing flights in a certain airspace area, and to quantify the impact of the different influence factors. The results of the case study were consolidated into an interactive performance monitoring dashboard. The dashboard provides a tool to identify and evaluate the causes of flight inefficiency in a particular airspace (ACC or charging zone) of the ECAC area. Different types of visualisations and visual analytics techniques are used to support the exploration of the relationship between flight efficiency and other variables related to airspace structure, as shown in the figures below.
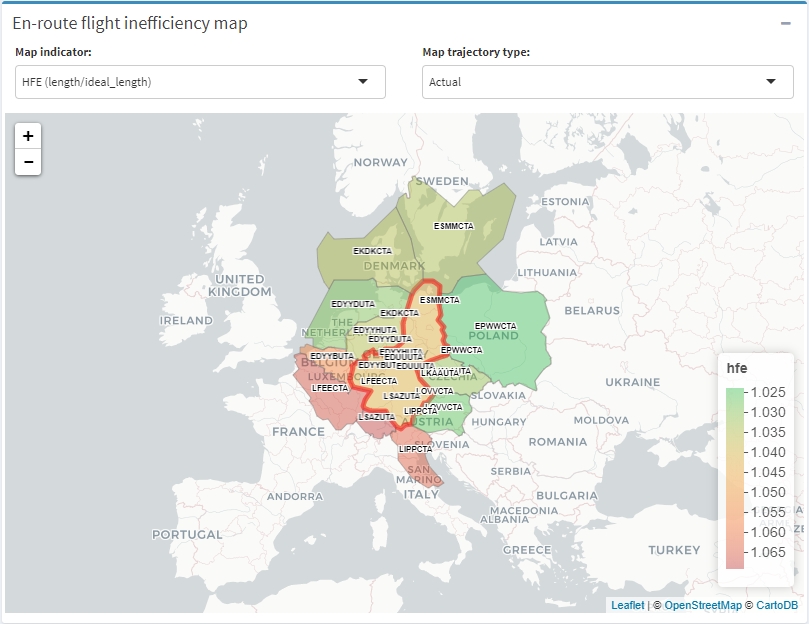
Figure 6 - Choropleth map to show the values of the KEA indicator (it measures the level of horizontal en-route flight inefficiency in actually flown trajectories over a period of 12 months). This view allows a comparison of the values between a selected region (highlighted in red) and its neighbours in order to see their single contributions.
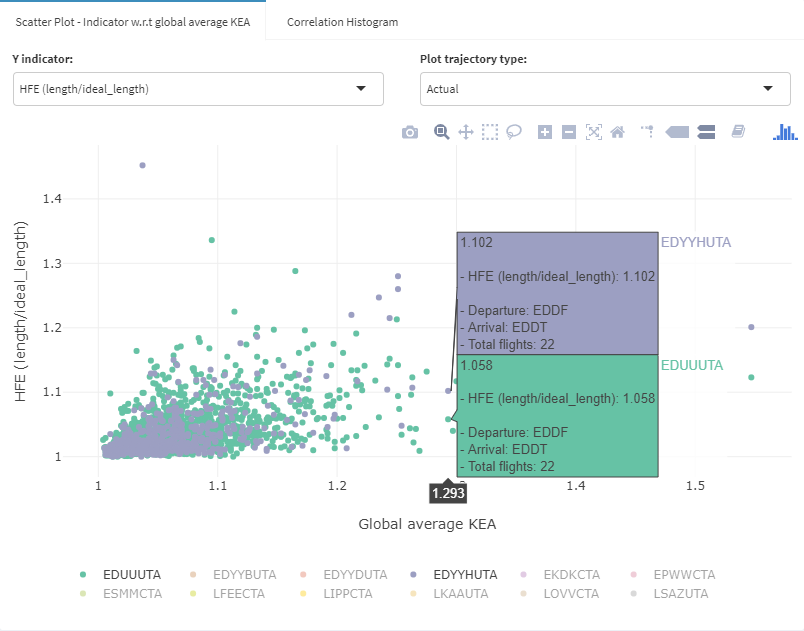
Figure 7 - The scatterplot comparing the value of the global average KEA (an indicator measuring the level of horizontal en-route flight inefficiency in actually flown trajectories over a period of 12 months) against the HFE values (a measure of the average en route additional distance with respect to the great circle distance) of each of the segments flown in the selected ACC. The double tooltip highlights the HFE components of a specific group of flights.
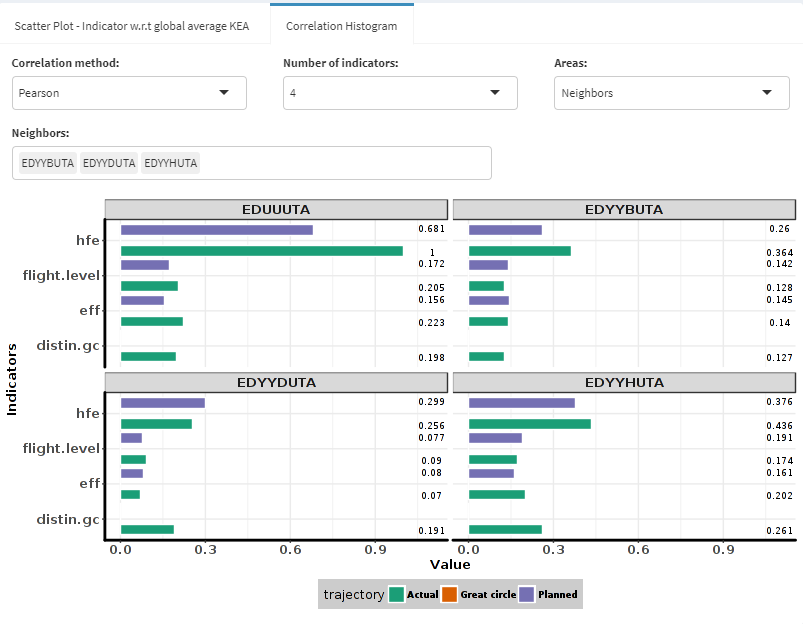
Figure 8 – Analysis of the most important contributions to the en-route flight inefficiency through the Pearson correlation values. The analysis, centred on the EDUUUTA zone and three of its neighbouring regions, shows the contributions for both the actual and planned flight trajectories.
More information at the project web-site (https://www.intuit-sesar.eu/ ) where it is possible to find the relevant documentation (e.g. deliverables and papers) about the development of the project